Popular Article
B2B Agency Statistics for 2026: Size, Age, Location and Services of 1,925 Providers
Statistics on the 1,925 B2B service providers listed on the30top: where they are based, how big and how old they are, what they do, which industries they serve and what they charge.
Key statistics at a glance
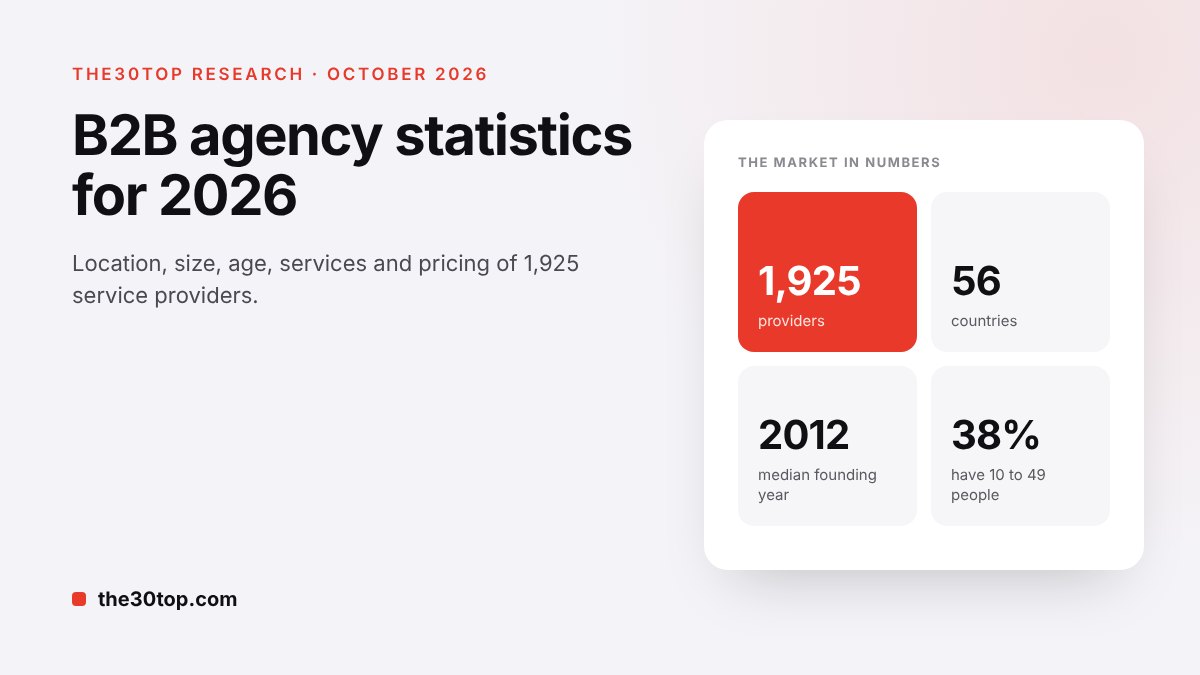
These statistics describe the 1,925 live company profiles on the30top on 24 October 2026: agencies, consultancies, development firms and other B2B service providers. Together they show the shape of the market a buyer meets when searching for a provider.
- live company profiles
- 1,925
- countries represented
- 56
- of providers with a listed country are US-based
- 69%
- median founding year
- 2012
- of providers with a listed team have 10 to 49 people
- 38%
- are CMS and e-commerce platform specialists
- 29%
- of those listing industries serve healthcare or medical clients
- 46%
- median listed hourly rate band
- $100 to $149
Where B2B service providers are based
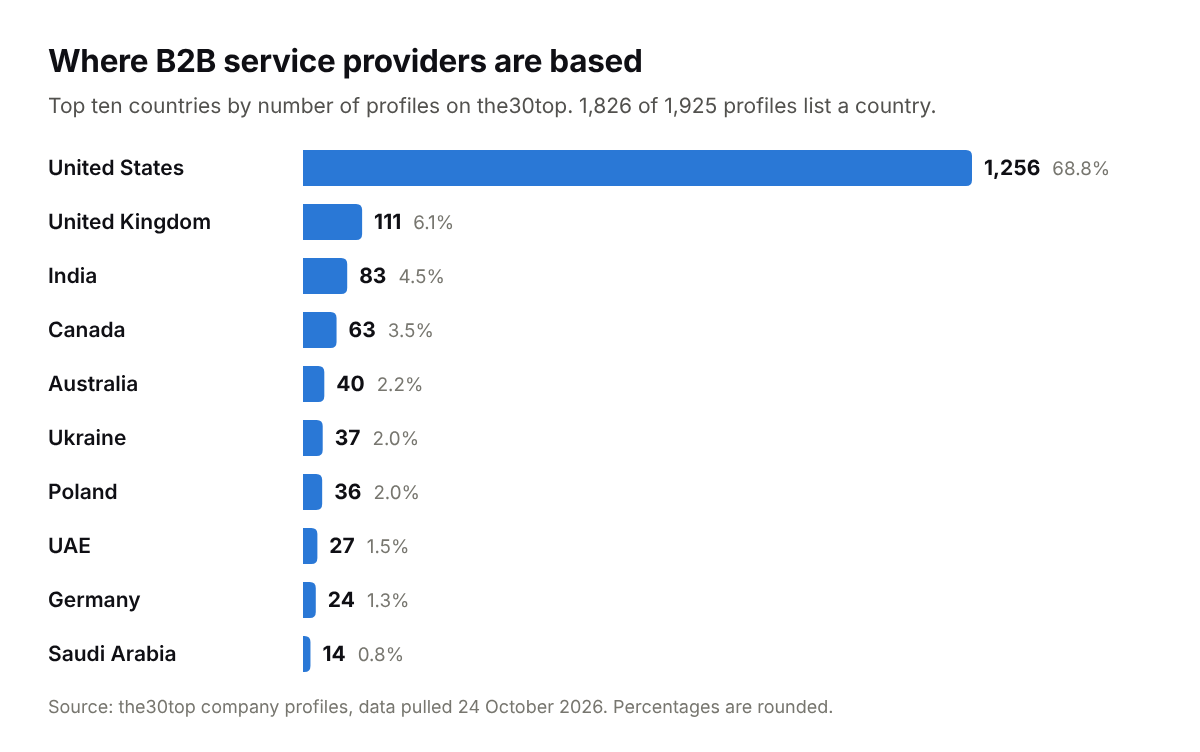
- 1,826 of the 1,925 profiles list a country, spread across 56 countries.
- 68.8% of providers that list a country are based in the United States (1,256 profiles).
- The United Kingdom is second with 111 profiles (6.1%), followed by India with 83 (4.5%) and Canada with 63 (3.5%).
- Australia (40), Ukraine (37) and Poland (36) each account for about 2% of providers.
- The United Arab Emirates (27), Germany (24) and Saudi Arabia (14) complete the top ten.
- New York is the most common city, with 105 providers including Brooklyn, ahead of London (65), Chicago (64), Los Angeles (58) and Austin (57).
| City | Country | Providers |
|---|---|---|
| New York | United States | 105 |
| London | United Kingdom | 65 |
| Chicago | United States | 64 |
| Los Angeles | United States | 58 |
| Austin | United States | 57 |
| Miami | United States | 38 |
| San Francisco | United States | 37 |
| Toronto | Canada | 31 |
| Denver | United States | 30 |
| Atlanta | United States | 29 |
New York includes profiles listing Brooklyn or New York City. San Diego also has 29 providers.
How providers differ by country
Location changes more than the time zone. The same kind of work is priced very differently depending on where the team sits, and the gap is widest in hourly rates. The table compares the countries with enough listed rates to compare fairly.
| Country | Profiles listing a rate | Rate under $50 | Rate $150 or more | Minimum under $10,000 | Minimum $25,000 or more |
|---|---|---|---|---|---|
| United States | 351 | 16% | 44% | 56% | 25% |
| Canada | 40 | 10% | 50% | 59% | 16% |
| United Kingdom | 44 | 27% | 11% | 63% | 16% |
| Poland | 20 | 35% | 0% | 33% | 38% |
| Ukraine | 33 | 48% | 0% | 62% | 18% |
| India | 44 | 89% | 0% | 67% | 10% |
Rate shares are of profiles listing an hourly rate; minimum shares are of profiles listing a minimum project size (395 in the United States, 44 in Canada, 43 in the United Kingdom, 21 in Poland, 34 in Ukraine and 49 in India). 24 October 2026.
Two patterns stand out. North American providers are the most likely to list $150 or more an hour, while none of the Indian, Ukrainian or Polish providers listing a rate do. Yet a low hourly rate does not always mean a low minimum: Polish providers are the most likely of any country here to require $25,000 or more, a sign that many of them sell larger development engagements rather than small jobs.
How big B2B service providers are
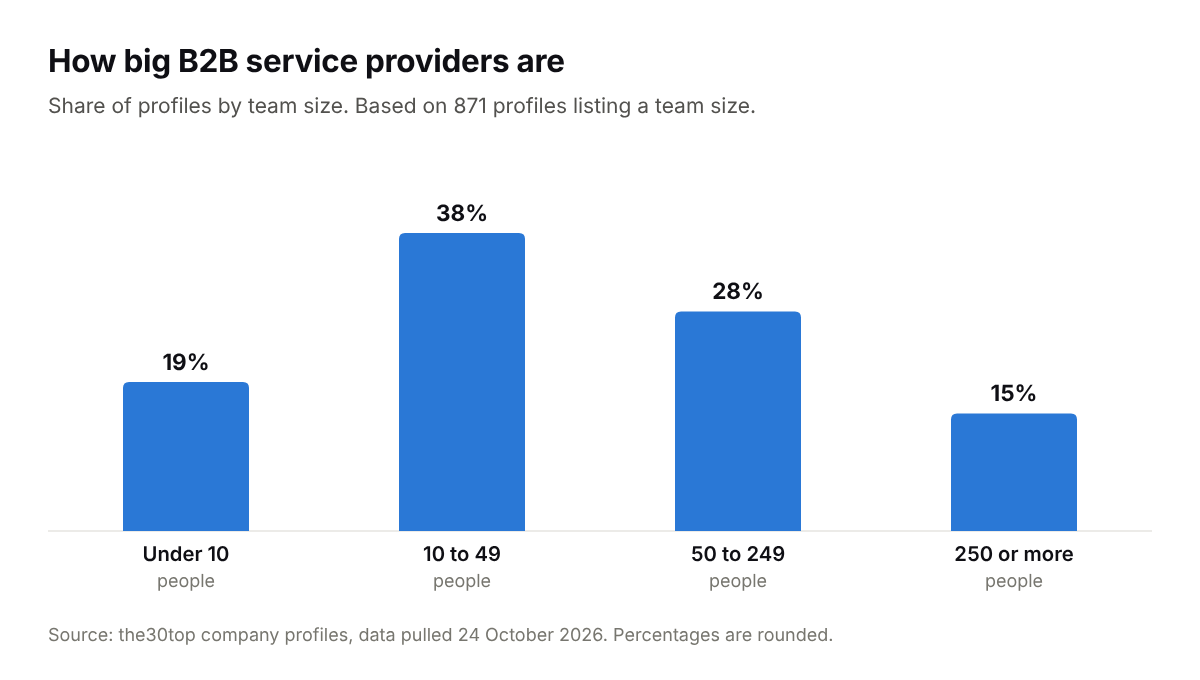
- 871 profiles list a team size.
- 38% of them have 10 to 49 people, the most common size.
- 28% have 50 to 249 people, 19% have fewer than 10 and 15% have 250 or more.
- Smaller firms list higher hourly rates: 41% of studios with 2 to 9 people list $150 or more per hour, compared with 9% of firms with 250 or more people.
Our agency hourly rate research explains why bigger firms list lower rates: most of the largest are software development, IT or outsourcing companies with teams in lower-cost locations.
Team size by service: studios and large firms
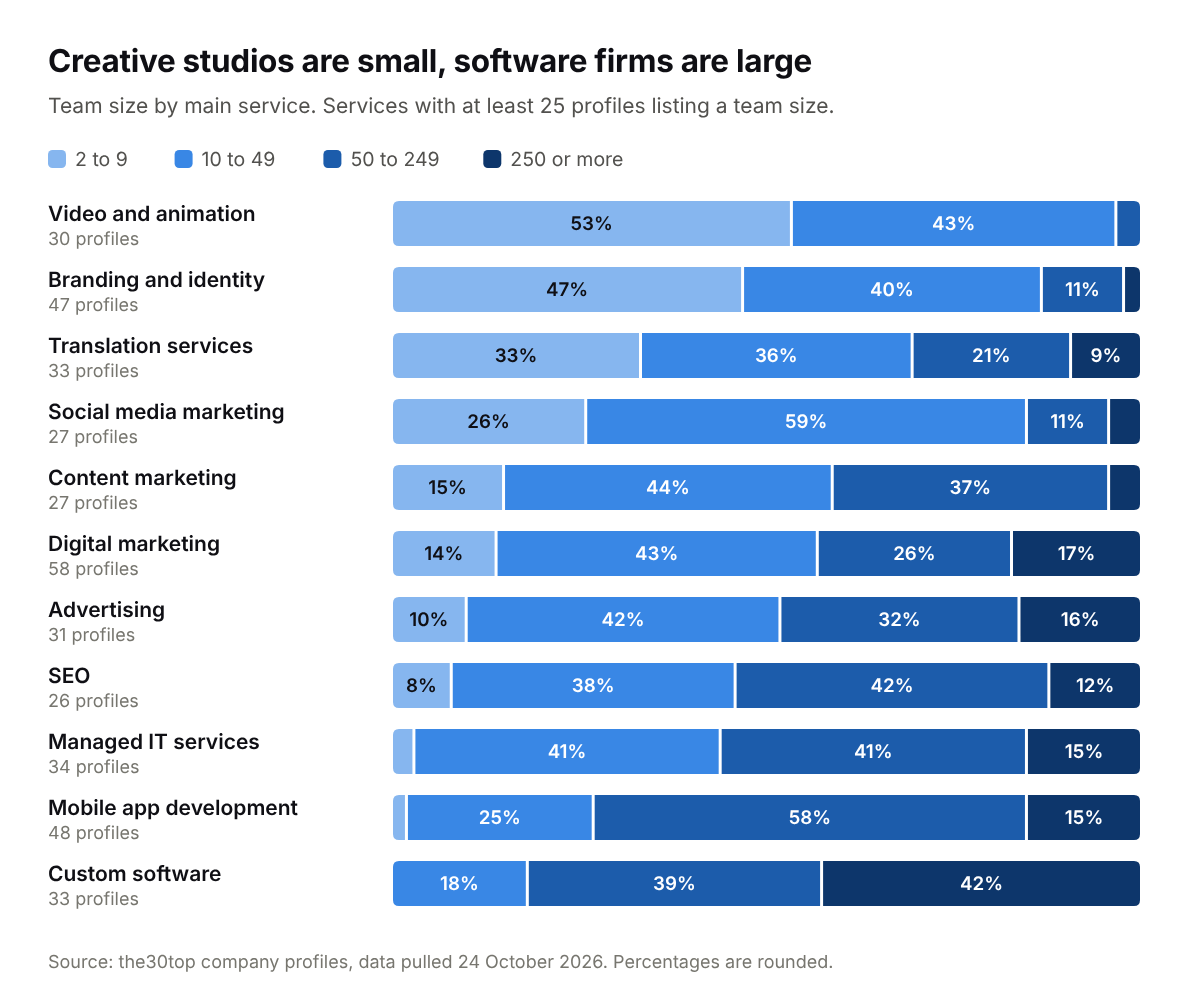
The typical size of a provider depends heavily on what it does. Creative work is done mostly by small studios, while software development and outsourcing are dominated by firms of 50 people or more.
| Main service | Profiles listing a team | 2 to 9 | 10 to 49 | 50 to 249 | 250 or more |
|---|---|---|---|---|---|
| Video and animation | 30 | 53% | 43% | 3% | 0% |
| Branding and identity | 47 | 47% | 40% | 11% | 2% |
| Translation services | 33 | 33% | 36% | 21% | 9% |
| Social media marketing | 27 | 26% | 59% | 11% | 4% |
| Web design | 21 | 24% | 43% | 33% | 0% |
| Content marketing | 27 | 15% | 44% | 37% | 4% |
| Digital marketing | 58 | 14% | 43% | 26% | 17% |
| Advertising | 31 | 10% | 42% | 32% | 16% |
| SEO | 26 | 8% | 38% | 42% | 12% |
| PPC and paid search | 21 | 5% | 71% | 24% | 0% |
| Managed IT services | 34 | 3% | 41% | 41% | 15% |
| Mobile app development | 48 | 2% | 25% | 58% | 15% |
| Custom software development | 33 | 0% | 18% | 39% | 42% |
| BPO and outsourcing | 22 | 9% | 5% | 23% | 64% |
Services with at least 20 profiles listing a team size, sorted by the share of small studios. Rows may not add to 100% because of rounding.
For buyers, this sets expectations. If you are hiring for branding or video, a team of five is normal and says nothing bad about the studio. If you are hiring for a large software build, a firm that small may struggle to staff it. PPC is the most uniform service: 71% of paid search providers have 10 to 49 people.
How team size relates to price
| Team size | Rate under $50 | Rate $150 or more | Minimum under $10,000 | Minimum $25,000 or more |
|---|---|---|---|---|
| 2 to 9 people | 24% | 41% | 66% | 13% |
| 10 to 49 people | 18% | 37% | 61% | 18% |
| 50 to 249 people | 36% | 17% | 49% | 30% |
| 250 or more | 56% | 9% | 44% | 31% |
Based on 570 profiles listing both a team size and an hourly rate, and 628 listing both a team size and a minimum project size, 24 October 2026.
Size pulls rates and minimums in opposite directions. The smallest studios are the most likely to charge $150 or more an hour, yet two thirds of them will take a project under $10,000. Firms of 250 or more are the most likely to charge under $50 an hour, yet almost a third require $25,000 or more. Small specialists sell expensive hours in small amounts; large firms sell cheaper hours in large blocks.
How old B2B service providers are
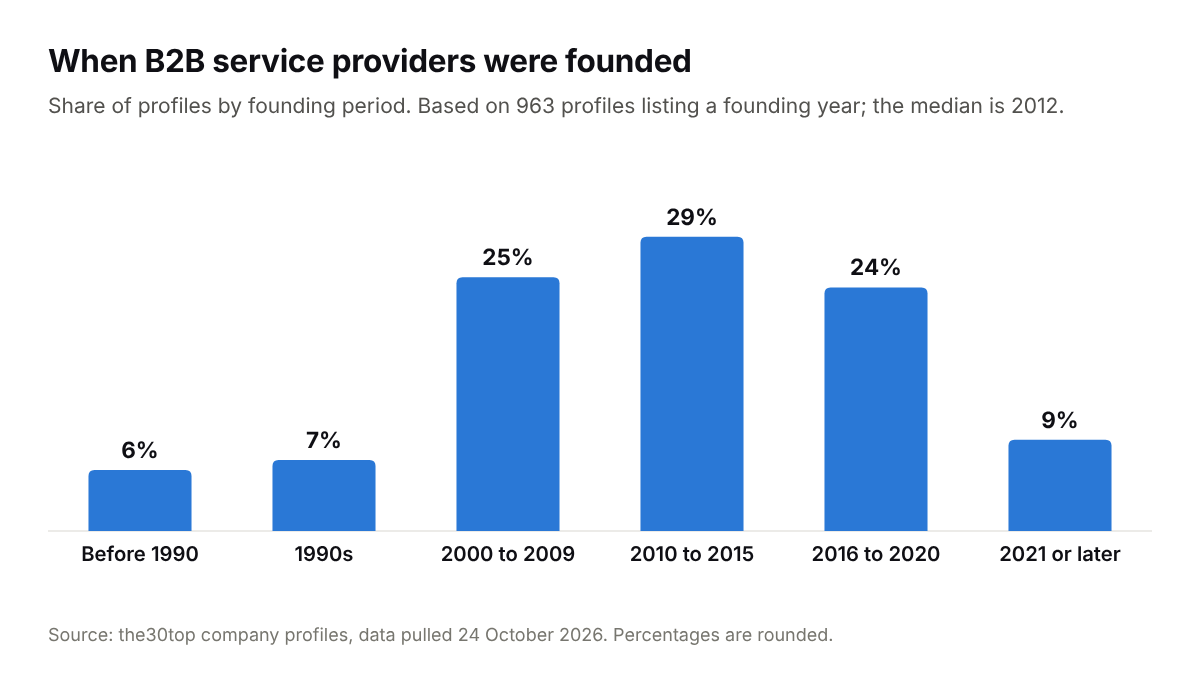
- 963 profiles list a founding year. The median is 2012, so half of these providers are 14 years old or younger.
- 62% were founded in 2010 or later, and 9% in 2021 or later.
- 13% were founded before 2000, including 6% before 1990.
- The busiest period was 2010 to 2015, when 29% of today's providers were founded.
Age alone says little about quality. In the30top Score, years in business is worth 5 of 100 points, far less than client reviews or delivery evidence, because a young studio with strong work should not rank below an older firm on age alone.
The oldest and youngest services
Founding years also vary by service, and they roughly trace the order in which each kind of work became a business of its own.
| Main service | Profiles listing a year | Median founding year |
|---|---|---|
| IT consulting | 23 | 2000 |
| Managed IT services | 40 | 2004 |
| Business consulting | 22 | 2005 |
| Accounting and payroll | 22 | 2007 |
| Public relations and digital PR | 18 | 2008 |
| Branding and identity | 51 | 2009 |
| Custom software development | 50 | 2010 |
| Advertising | 44 | 2010 |
| Digital marketing | 69 | 2012 |
| SEO | 23 | 2012 |
| Mobile app development | 50 | 2013 |
| PPC and paid search | 21 | 2013 |
| Social media marketing | 25 | 2014 |
| Web design | 22 | 2015 |
| AI development | 21 | 2015 |
| Blockchain development | 16 | 2016 |
Services with at least 15 profiles listing a founding year, 24 October 2026.
IT and business consulting firms are the oldest, with a median founding year of 2000 to 2005. Social media, AI and blockchain providers are the youngest, which matches when those markets appeared. Half of AI development providers were founded in 2015 or earlier, years before generative AI tools came into wide use, so a founding year says little about how long a firm has done AI work. Ask how long the team has done the specific work you need.
What B2B service providers do
- Profiles span 101 main services.
- CMS and e-commerce platform specialists are the largest group: 552 providers (28.7%) focus on WordPress, Shopify, Webflow, Wix, Shopware, WooCommerce, Squarespace, PrestaShop, Magento, BigCommerce, Salesforce Commerce Cloud or OpenCart.
- WordPress development is the single most common main service, with 154 providers, followed by Shopify development (126) and digital marketing (109).
- Branding and identity and advertising have 79 providers each, and mobile app development, Webflow development and custom software development have 50 each.
| Service family | Providers | Share |
|---|---|---|
| CMS and e-commerce platform specialists | 552 | 28.7% |
| Marketing | 310 | 16.1% |
| Software, app and web development | 223 | 11.6% |
| Design and creative | 211 | 11.0% |
| Business services | 206 | 10.7% |
| IT services | 154 | 8.0% |
| Advertising and PR | 130 | 6.8% |
| Other specialist services | 72 | 3.7% |
| No main service listed | 67 | 3.5% |
Grouped by each profile's main service, 24 October 2026. Shares are of all 1,925 profiles.
Specialists and generalists
905 profiles break down their work into a service mix, stating what share of their time goes to each service. That breakdown shows how specialised providers really are, beyond the single main service they are listed under.
- 14% list a single service, and 14% put three quarters or more of their work into one service.
- 62% have no service that takes more than 30% of their work, which makes them generalists in practice.
- Digital marketing agencies most often list SEO, email marketing and social media marketing in their mix. Mobile app developers most often add web development, custom software and AI development, and branding agencies most often add web design and graphic design.
- services offered on average
- 4.3
- offer five services or more
- 48%
- median share of work in a provider's largest service
- 25%
- put half or more of their work into one service
- 22%
A broad service list is not a weakness in itself, but it changes how you should check a provider. Ask what share of their work, and of their team, goes to the service you are buying, and ask for examples of that service specifically.
Which industries they serve
- 907 profiles list the industries they serve, an average of 6.1 industries each.
- Medical is the most listed industry, named by 272 providers (30% of those listing industries).
- 46% list medical or healthcare clients, which makes health the most served sector overall.
- Education (28%), financial services (27%) and eCommerce (26%) follow.
| Industry | Providers | Share of providers listing industries |
|---|---|---|
| Medical | 272 | 30% |
| Education | 250 | 28% |
| Financial services | 247 | 27% |
| eCommerce | 233 | 26% |
| Business services | 231 | 25% |
| Consumer products and services | 197 | 22% |
| Information technology | 190 | 21% |
| Manufacturing | 183 | 20% |
| Retail | 165 | 18% |
| Legal | 150 | 17% |
Providers can list several industries, so shares add up to more than 100%.
What they charge
- 652 profiles (34%) list an hourly rate. The median falls in the $100 to $149 band, and 29% list $150 or more.
- 723 profiles (38%) list a minimum project size. 57% accept projects under $10,000, and 22% require $25,000 or more.
- 70% of branding agencies list $150 or more per hour, the highest share of any service with at least 15 listed rates.
The detail is in our three pricing studies: agency hourly rates by country and service, agency minimum project sizes, and how much branding costs. For how agencies turn those rates into prices, see agency pricing models explained.
How complete provider profiles are
- 90% of profiles list a website (1,740).
- 57% have a description of 300 characters or more (1,092).
- 50% list a founding year (963), 47% list client industries (907) and 45% list a team size (871).
- 47% break down their service mix (905), 38% list a minimum project size (723) and 34% list an hourly rate (652).
- 20% list office locations (393), and 46% of those list more than one office.
- 7% list the languages they work in (144), and 22% of those work in more than one language.
Profile completeness is one of the six factors in the30top Score, worth 10 of 100 points, so a company that leaves fields empty ranks lower than its work might deserve. Companies can claim and complete their profile for free.
What these statistics mean if you are hiring
- 1Expect a small team for creative work. Half of video and branding studios have fewer than 10 people. Judge them on their portfolio and references, not their headcount.
- 2Check capacity for large builds. Software and app developers are mostly 50 people or more. If a smaller firm bids on a large build, ask who exactly will staff it.
- 3Compare location and budget together. Providers in India, Ukraine and Poland rarely list more than $100 an hour, but some still set high minimums. Read both fields before you shortlist.
- 4Do not read age as quality. The median provider is 14 years old, and the youngest services are newer still. Ask how long the team has done your kind of work.
- 5Test generalists on your service. Most providers offer four or more services. Ask what share of their work goes to the one you need, and ask for examples of it.
- 6Look for industry experience you can check. Nearly half the providers that list industries serve healthcare, so a claim of healthcare experience is common. Ask for clients and results in your sector.
To turn a shortlist into a decision, our guides on agency pricing models and agency minimum project sizes help you check whether a provider fits your budget before you contact it.
Get matched with providers that fit your projectHow we compiled these statistics
All figures come from the 1,925 live company profiles on the30top on 24 October 2026. Profiles are created by companies themselves or by our research team from public sources, and every figure is based on the profiles that list the field in question; the number behind each percentage is stated.
We merged obvious duplicates before counting: “UAE” with “United Arab Emirates”, Northern Ireland with the United Kingdom, and Brooklyn and “New York City” with New York. Service families group each profile's main service.
These are statistics about the providers listed on the30top, not a census of every agency in the world. The directory leans toward the United States, and fields such as team size and founding year are self-reported.
How to cite these statistics
You are welcome to use these statistics in articles, reports and presentations. Please credit the30top and link to this page.
Suggested citation
the30top, “B2B Agency Statistics for 2026: Size, Age, Location and Services of 1,925 Providers”, data pulled 24 October 2026. https://the30top.com/resources/b2b-agency-statistics
Frequently asked questions
How many B2B service providers are listed on the30top?
1,925 live company profiles on 24 October 2026, across 56 countries and 101 main services.
Where are most B2B agencies based?
In our data, 68.8% of providers that list a country are in the United States, followed by the United Kingdom (6.1%), India (4.5%) and Canada (3.5%). New York, London and Chicago are the most common cities.
How big is a typical B2B agency?
Among providers listing a team size, 10 to 49 people is the most common size (38%). 19% have fewer than 10 people and 15% have 250 or more.
How old is the typical agency?
The median founding year is 2012. 62% of providers listing a founding year were founded in 2010 or later, and 13% before 2000.
What is the most common service among B2B providers?
CMS and e-commerce platform work. 28.7% of profiles are platform specialists, and WordPress development is the single most common main service with 154 providers.
Which industries do agencies serve most?
Health. 46% of providers that list client industries serve medical or healthcare clients. Education, financial services and eCommerce follow.
Are smaller agencies more expensive?
Per hour, often yes. 41% of studios with 2 to 9 people list $150 or more an hour, compared with 9% of firms with 250 or more. But small studios are also the most likely to accept small projects: 66% take projects under $10,000.
Which services have the youngest providers?
Blockchain development (median founding year 2016), AI development, web design (both 2015) and social media marketing (2014). IT consulting firms are the oldest, with a median founding year of 2000.
Can I use these statistics in my own work?
Yes. Please credit the30top and link to this page; a suggested citation is included above.
About the author
the30top Research Team (Research & analysis). We research service categories, interview buyers and maintain the30top rankings. Resource content is independent of listings and never paid for.
Related reading
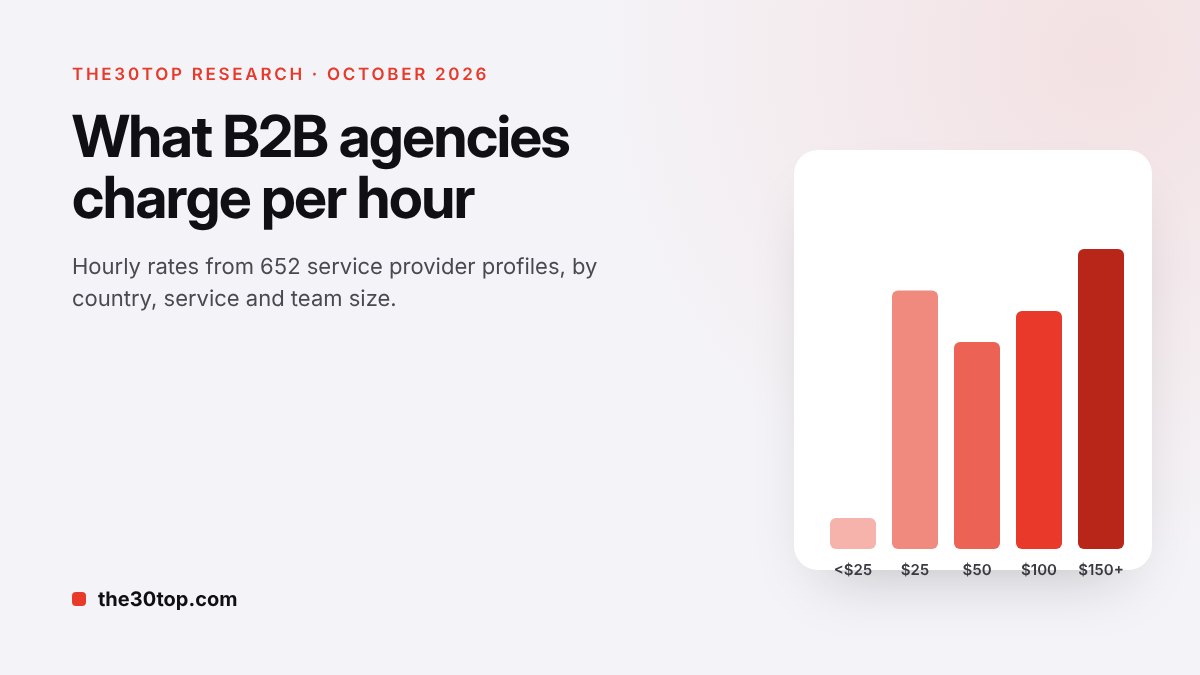
Agency Hourly Rates in 2026: What 652 B2B Service Providers Charge
We analyzed the hourly rates listed on 652 B2B service provider profiles on the30top. Here is what agencies charge by country, service and team size, and how to use hourly rates when you compare proposals.
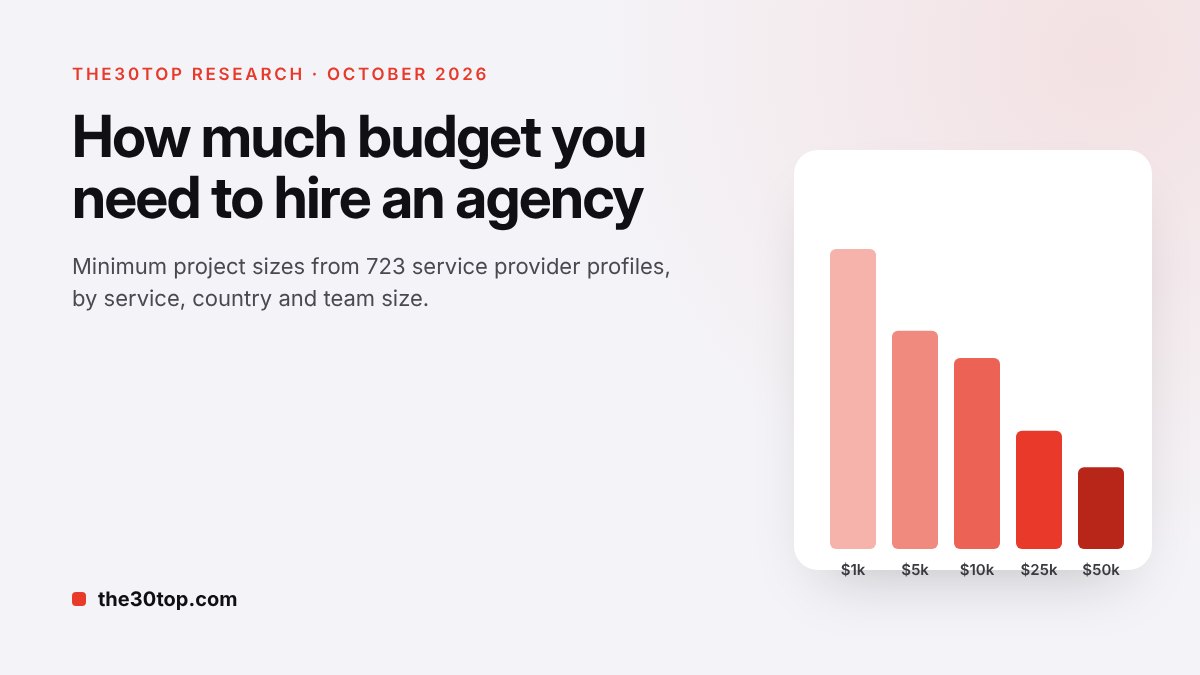
Agency Minimum Project Size: How Much Budget You Need to Hire an Agency in 2026
Most agencies set a minimum project size. We analyzed 723 provider profiles on the30top to show typical minimums by service, country and team size, and what you can get at each budget level.
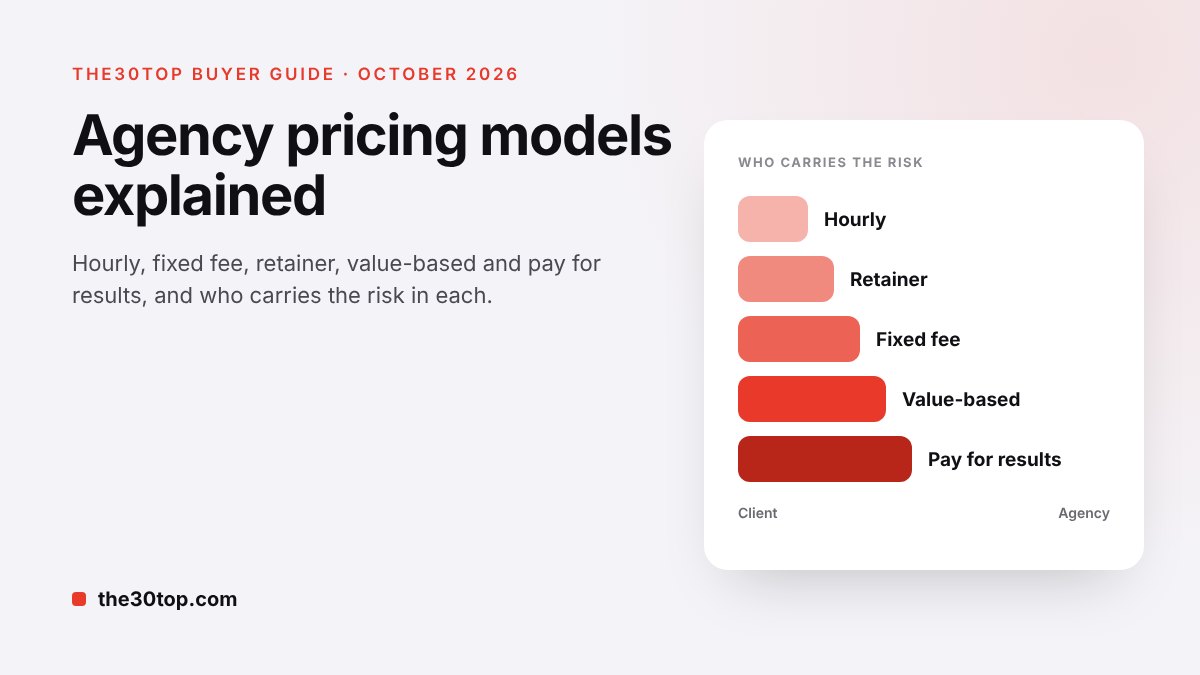
Agency Pricing Models Explained: Hourly, Fixed Fee, Retainer, Value-Based and Pay for Results
How each agency pricing model works, who carries the risk when work runs over, one project priced five different ways, and which model suits which kind of work.
Explore the30top
Ready to shortlist a partner?
Move from research to a shortlist with companies ranked by our published score.